Wednesday, June 30, 2010

A4 - Area estimation of images with defined edges

PART I: Analytic measurement vs. Green's method for obtaining the area of regular geometric shapes

The analytic measurements are obtained using the formulas for area:

* square: length x width (in pixels)
* circle: pi x (radius squared)

The area using Green's method on the other hand is obtained using the formula:
The figures below are the black and white images of the geometric shapes used. These are made using the scilab code done for activity 2.

Square
Width: 200 pixels
Height: 200 pixels
Analytic measurement: 4000 pixels
Area using the Green's method: 40000 pixels
% difference: 0
Figure 1: Black and White Square
Figure 2: Plot of Square Edge Pixels


Circle

Radius: 104.99 pixels
Analytic measurement: 34636 pixels
Area using the Green's method: 34034 pixels
% difference: 1.74

Figure 3: Black and white Circle with radius

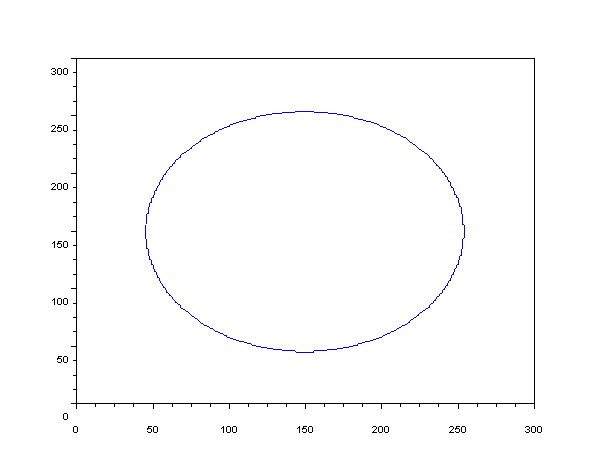
Figure 4: Plot of circle edge pixels


Circle

Radius: 75 pixels
Analytic measurement: 17671.46 pixels
Area using the Green's method: 17350
% difference: 1.82

Figure 5: Black and white Circle with radius
Figure 6: Plot of circle edge pixels


Circle

Radius: 45 pixels
Analytic measurement: 6361.73 pixels
Area using the Green's method: 6201 pixels
% difference: 2.53


Figure 7: Black and white Circle with radius
Figure 8: Plot of circle edge pixels

Using Scilab's function follow and Green's method, the area of regular geometric shapes (square and circles with different radii) are determinded. The % difference between the two methods are relatively small. As observed above, we can say that as the radius of the circle becomes smaller, the % difference between the two methods increases.


PART 2: Finding the lot area using a map image

I have chosen to use the map of UPLB, particularly the lower grounds of Freedom Park.

Figure 10: Map of UPLB's Freedom Park

source: http://www.nationsonline.org/oneworld/map/google_map_philippines.htm


To obtain the figure below, the following image processing techniques were used:
1. Using GIMP, select the place which you want to determine the area of.
2. Fill the background with black, and the selected area with white (binarize it :))

LAND AREA:
conversion factor: 84 pixels = 100m
Analytic area: 20619.17 pixels
Green's method: 20602.5 pixels
% different: 0.08


Figure 11: Black and white image of the land
Figure 11: Plot of edge pixels

Thank you to Rap-rap for helping me with this activity! :D

I would like to give myself a grade of 10 for this activity.

Friday, June 25, 2010

A3 - Image Types and Formats


In this activity, I learned about image types and image formats.

There are four basic types of images:


1. Binary images: images that are comprised of pixels which is either black or white (either have the value 0 or 1).


example:


2. Grayscale images: black and white images where the pixel may have the value of 0 (black), 255 (white) and everything in between (gray).


example:


3. Trucolor images: comprised of three channels or bands: green, blue and red channels. Each pixel may have a value of 0-256 for each band depending on the intensity of the color.


example:

FileSize: 1852690

Format: JPEG

Width: 2592

Height: 1944

Depth: 8

StorageType: truecolor

NumberOfColors: 0

ResolutionUnit: inch

XResolution: 72.000000


4. Indexed images: are colored images in which the colors are being represented by numbers. These numbers denote the color index in a color map.


example:

FileSize: 19077

Format: GIF

Width: 491

Height: 338

Depth: 8

StorageType: indexed

NumberOfColors: 256

ResolutionUnit: centimeter

XResolution: 72.000000

YResolution: 72.000000


There are two categories of image formats -lossy and lossless. As the name implies, lossy formats loss information about the image during compression. Saving in a lossless image format, on the otherhand, enables storage of all information about the image.


Differences between the image formats:


* GIF - Graphics Interchange Format (.gif):

- lossless LZW compression

- can be saved with a max of 256 colours


example:

source:
sohowww.estec.esa.nl/.../eit_171_981013.gif


* PNG - Portable Network Graphics (.png):

- created as free, open-source successor of GIF

- lossless ZIP compression

- portable

- can be saved with a max of 256 colours

- often used for editing pictures


example:

FileSize: 463182

Format: PNG

Width: 502

Height: 376

Depth: 8

StorageType: truecolor

NumberOfColors: 0

ResolutionUnit: centimeter

XResolution: 37.790000

YResolution: 37.790000

source: Jonats


* JPEG - Joint Photographic Experts Group (.jpg):

- lossy compression because it doesn’t include certain details about the image

- files saved in this format are small; therefore

- used in almost all digicams to save images


example:
source:
elmore.cc/images/Apr04/Small/tn_PICT1711_TIF.jpg

sources for format descriptions:

http://www.scantips.com/basics09.html

http://en.wikipedia.org/wiki/Image_file_formats


In procedure no.5, a truecolor image (shown below)is converted into 1) binary image and 2) grayscale image

original:


Binary:


Grayscale:

In procedure no.6 and 7, the graph used in Activity 1 is converted into a grayscale image then its gray level histogram is determined using the function histplot in scilab.


Scanned Image:


Histogram for the scanned image:

As shown in the histogram, the best threshold value, in order to separate the blacks and whites, is determined to be approximately equal to 0.95. Using this value, the grayscale image is converted to binary image. The resulting image is shown below:


Image after applying threshold:


The result is a more resolved image of the original graph.

Problem(s) encountered:


1) I have just realized that ~90% of the images in my laptop are JPEG images :(

2) blogging is hard...really hard.

Arigato guzaimasu to Jonats for helping me with this activity. :)

I would like to give myself a grade of 10 for this activity.