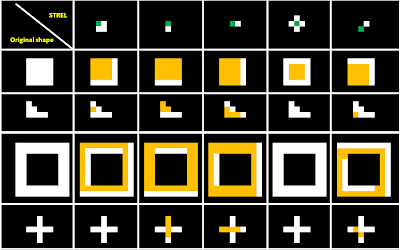
Predicted outcomes upon application of erosion and dilation operations:
Before using scilab to simulate the results when we apply the erosion and dilation operations, we were first asked to predict what these results would be. I used Microsoft word to illustrate my predictions by putting gridlines and drawing squares as pixels.
Here are my predictions...

Figure 1: Predictions for erosion
NOTE: The resulting image is comprised ONLY of the yellow pixels. The white pixels are only included to illustrate how much of the original image are removed.Figure 2: Predictions for dilation
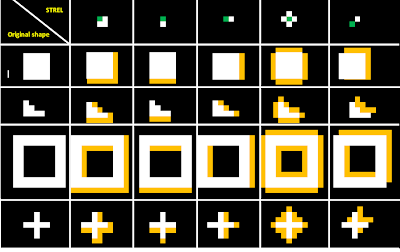
NOTE: The resulting image is the combination of the yellow and white pixels.
Outcomes upon application of erosion and dilation operators using SCILAB:
EROSION:
NOTE: The resulting image is the combination of the yellow and white pixels.
Outcomes upon application of erosion and dilation operators using SCILAB:
EROSION:
Figure 7: Erosion using a diagonal (0 1; 1 0) strel
NOTE: Blank figure means that no pixel remained after the erosion operation.
DILATION:
Figure 12: Dilation using a diagonal (0 1; 1 0) strel
I'm glad to see that my predictions are correct! :D
Other morphological operators:
1. Thin: performs a thinning operation on binary objects
below are examples of what your object will look like after skel operation:
CODE:
stacksize(1000000);
o1 = zeros(11,11);
o1(4:8,4:8) = 1
//imshow(o1,[])
o2 = zeros(8,8);
o2(4,3) = 1;
o2(5,3:4) = 1;
o2(6,3:6) = 1;
//imshow(o2,[])
o3 = zeros(14,14);
o3(3:12,3:12) = 1;
o3(5:10,5:10) = 0;
//imshow(o3,[])
o4 = zeros(9,9);
o4(3:7,5) = 1;
o4(5,3:7) = 1;
//imshow(o4,[])
//Structuring elements
a = [1 1; 1 1];
b = [1; 1];
c = [1 1];
d = [0 1 0; 1 1 1; 0 1 0]
e = [0 1; 1 0]
////////////////////////////////////////////////////////////////
//erode
a1 = erode(o1, a, [1,1]);
a2 = erode(o2, a, [1,1]);
a3 = erode(o3, a, [1,1]);
a4 = erode(o4, a, [1,1]);
subplot(1, 4, 1);imshow(a1, []);
subplot(1, 4, 2);imshow(a2, []);
subplot(1, 4, 3);imshow(a3, []);
subplot(1, 4, 4);imshow(a4, []);
b1 = erode(o1, b, [1,1]);
b2 = erode(o2, b, [1,1]);
b3 = erode(o3, b, [1,1]);
b4 = erode(o4, b, [1,1]);
subplot(1, 4, 1);imshow(b1, []);
subplot(1, 4, 2);imshow(b2, []);
subplot(1, 4, 3);imshow(b3, []);
subplot(1, 4, 4);imshow(b4, []);
c1 = erode(o1, c, [1,1]);
c2 = erode(o2, c, [1,1]);
c3 = erode(o3, c, [1,1]);
c4 = erode(o4, c, [1,1]);
subplot(1, 4, 1);imshow(c1, []);
subplot(1, 4, 2);imshow(c2, []);
subplot(1, 4, 3);imshow(c3, []);
subplot(1, 4, 4);imshow(c4, []);
d1 = erode(o1, d, [2,2]);
d2 = erode(o2, d, [2,2]);
d3 = erode(o3, d, [2,2]);
d4 = erode(o4, d, [2,2]);
subplot(1, 4, 1);imshow(d1, []);
subplot(1, 4, 2);imshow(d2, []);
subplot(1, 4, 3);imshow(d3, []);
subplot(1, 4, 4);imshow(d4, []);
e1 = erode(o1, e, [2,1]);
e2 = erode(o2, e, [2,1]);
e3 = erode(o3, e, [2,1]);
e4 = erode(o4, e, [2,1]);
subplot(1, 4, 1);imshow(e1, []);
subplot(1, 4, 2);imshow(e2, []);
subplot(1, 4, 3);imshow(e3, []);
subplot(1, 4, 4);imshow(e4, []);
/////////////////////////////////////////////////////////
//dilate
a1 = dilate(o1, a, [1,1]);
a2 = dilate(o2, a, [1,1]);
a3 = dilate(o3, a, [1,1]);
a4 = dilate(o4, a, [1,1]);
subplot(1, 4, 1);imshow(a1, []);
subplot(1, 4, 2);imshow(a2, []);
subplot(1, 4, 3);imshow(a3, []);
subplot(1, 4, 4);imshow(a4, []);
b1 = dilate(o1, b, [1,1]);
b2 = dilate(o2, b, [1,1]);
b3 = dilate(o3, b, [1,1]);
b4 = dilate(o4, b, [1,1]);
subplot(1, 4, 1);imshow(b1, []);
subplot(1, 4, 2);imshow(b2, []);
subplot(1, 4, 3);imshow(b3, []);
subplot(1, 4, 4);imshow(b4, []);
c1 = dilate(o1, c, [1,1]);
c2 = dilate(o2, c, [1,1]);
c3 = dilate(o3, c, [1,1]);
c4 = dilate(o4, c, [1,1]);
subplot(1, 4, 1);imshow(c1, []);
subplot(1, 4, 2);imshow(c2, []);
subplot(1, 4, 3);imshow(c3, []);
subplot(1, 4, 4);imshow(c4, []);
d1 = dilate(o1, d, [2,2]);
d2 = dilate(o2, d, [2,2]);
d3 = dilate(o3, d, [2,2]);
d4 = dilate(o4, d, [2,2]);
subplot(1, 4, 1);imshow(d1, []);
subplot(1, 4, 2);imshow(d2, []);
subplot(1, 4, 3);imshow(d3, []);
subplot(1, 4, 4);imshow(d4, []);
e1 = dilate(o1, e, [2,1]);
e2 = dilate(o2, e, [2,1]);
e3 = dilate(o3, e, [2,1]);
e4 = dilate(o4, e, [2,1]);
subplot(1, 4, 1);imshow(e1, []);
subplot(1, 4, 2);imshow(e2, []);
subplot(1, 4, 3);imshow(e3, []);
subplot(1, 4, 4);imshow(e4, []);
I would like to give my self a grade of 10/10 for this activity since I was able to achieve the desired results.
Thanks to Joseph and Dane for helping me with this activity!
Thanks to BA for keeping me company while finishing this activity. :P
references:
1. 187 activity 9 handout
2. http://homepages.inf.ed.ac.uk/rbf/HIPR2/skeleton.htm
Other morphological operators:
1. Thin: performs a thinning operation on binary objects
Figure 13: objects(left), objects after thinning operation(right)
2. Skel: another thinning operation where the output object can be further pruned by thresholdingbelow are examples of what your object will look like after skel operation:
Figure 14: objects(left), objects after skel operation(right)
CODE:
stacksize(1000000);
o1 = zeros(11,11);
o1(4:8,4:8) = 1
//imshow(o1,[])
o2 = zeros(8,8);
o2(4,3) = 1;
o2(5,3:4) = 1;
o2(6,3:6) = 1;
//imshow(o2,[])
o3 = zeros(14,14);
o3(3:12,3:12) = 1;
o3(5:10,5:10) = 0;
//imshow(o3,[])
o4 = zeros(9,9);
o4(3:7,5) = 1;
o4(5,3:7) = 1;
//imshow(o4,[])
//Structuring elements
a = [1 1; 1 1];
b = [1; 1];
c = [1 1];
d = [0 1 0; 1 1 1; 0 1 0]
e = [0 1; 1 0]
////////////////////////////////////////////////////////////////
//erode
a1 = erode(o1, a, [1,1]);
a2 = erode(o2, a, [1,1]);
a3 = erode(o3, a, [1,1]);
a4 = erode(o4, a, [1,1]);
subplot(1, 4, 1);imshow(a1, []);
subplot(1, 4, 2);imshow(a2, []);
subplot(1, 4, 3);imshow(a3, []);
subplot(1, 4, 4);imshow(a4, []);
b1 = erode(o1, b, [1,1]);
b2 = erode(o2, b, [1,1]);
b3 = erode(o3, b, [1,1]);
b4 = erode(o4, b, [1,1]);
subplot(1, 4, 1);imshow(b1, []);
subplot(1, 4, 2);imshow(b2, []);
subplot(1, 4, 3);imshow(b3, []);
subplot(1, 4, 4);imshow(b4, []);
c1 = erode(o1, c, [1,1]);
c2 = erode(o2, c, [1,1]);
c3 = erode(o3, c, [1,1]);
c4 = erode(o4, c, [1,1]);
subplot(1, 4, 1);imshow(c1, []);
subplot(1, 4, 2);imshow(c2, []);
subplot(1, 4, 3);imshow(c3, []);
subplot(1, 4, 4);imshow(c4, []);
d1 = erode(o1, d, [2,2]);
d2 = erode(o2, d, [2,2]);
d3 = erode(o3, d, [2,2]);
d4 = erode(o4, d, [2,2]);
subplot(1, 4, 1);imshow(d1, []);
subplot(1, 4, 2);imshow(d2, []);
subplot(1, 4, 3);imshow(d3, []);
subplot(1, 4, 4);imshow(d4, []);
e1 = erode(o1, e, [2,1]);
e2 = erode(o2, e, [2,1]);
e3 = erode(o3, e, [2,1]);
e4 = erode(o4, e, [2,1]);
subplot(1, 4, 1);imshow(e1, []);
subplot(1, 4, 2);imshow(e2, []);
subplot(1, 4, 3);imshow(e3, []);
subplot(1, 4, 4);imshow(e4, []);
/////////////////////////////////////////////////////////
//dilate
a1 = dilate(o1, a, [1,1]);
a2 = dilate(o2, a, [1,1]);
a3 = dilate(o3, a, [1,1]);
a4 = dilate(o4, a, [1,1]);
subplot(1, 4, 1);imshow(a1, []);
subplot(1, 4, 2);imshow(a2, []);
subplot(1, 4, 3);imshow(a3, []);
subplot(1, 4, 4);imshow(a4, []);
b1 = dilate(o1, b, [1,1]);
b2 = dilate(o2, b, [1,1]);
b3 = dilate(o3, b, [1,1]);
b4 = dilate(o4, b, [1,1]);
subplot(1, 4, 1);imshow(b1, []);
subplot(1, 4, 2);imshow(b2, []);
subplot(1, 4, 3);imshow(b3, []);
subplot(1, 4, 4);imshow(b4, []);
c1 = dilate(o1, c, [1,1]);
c2 = dilate(o2, c, [1,1]);
c3 = dilate(o3, c, [1,1]);
c4 = dilate(o4, c, [1,1]);
subplot(1, 4, 1);imshow(c1, []);
subplot(1, 4, 2);imshow(c2, []);
subplot(1, 4, 3);imshow(c3, []);
subplot(1, 4, 4);imshow(c4, []);
d1 = dilate(o1, d, [2,2]);
d2 = dilate(o2, d, [2,2]);
d3 = dilate(o3, d, [2,2]);
d4 = dilate(o4, d, [2,2]);
subplot(1, 4, 1);imshow(d1, []);
subplot(1, 4, 2);imshow(d2, []);
subplot(1, 4, 3);imshow(d3, []);
subplot(1, 4, 4);imshow(d4, []);
e1 = dilate(o1, e, [2,1]);
e2 = dilate(o2, e, [2,1]);
e3 = dilate(o3, e, [2,1]);
e4 = dilate(o4, e, [2,1]);
subplot(1, 4, 1);imshow(e1, []);
subplot(1, 4, 2);imshow(e2, []);
subplot(1, 4, 3);imshow(e3, []);
subplot(1, 4, 4);imshow(e4, []);
I would like to give my self a grade of 10/10 for this activity since I was able to achieve the desired results.
Thanks to Joseph and Dane for helping me with this activity!
Thanks to BA for keeping me company while finishing this activity. :P
references:
1. 187 activity 9 handout
2. http://homepages.inf.ed.ac.uk/rbf/HIPR2/skeleton.htm


